
.svg)

Since SAP Fiori was introduced over five years ago, customers around the world have been investing in transformation projects to modernize their business and take advantage of this innovative user interface.
As SAP partners, we help our customers with SAP Fiori implementations and extensions. And when called for, we build brand-new SAP Fiori applications to accelerate UI transformation and build around our clients’ specific needs.
Our extensive experience in this area generally means a smooth journey for our clients, and though we’re certainly not immune to some of the challenges that come up along the way, we have the advantage of sharing lessons learned from previous projects.
The Burning Question Our Clients Have After Go-Live
In this blog, we’ll be exploring a common thread we find among our clients. Whether they’re using an out-of-the-box SAP Fiori solution or something more customized, nearly every one of our clients has the same question after go-live:
“How are our users actually engaging with this interface?”
There are a few different reasons why a client might be asking this question, and it may be phrased slightly differently based on what they’re really trying to find out. Below, we’ve broken down the questions and translated it based on the underlying meaning.
Question: What are the most frequently used Fiori applications?
Translation: Which areas can we improve and where can we optimize further?
Translation: Is there an issue with our business process, or are users just avoiding the application? Who can we talk to for feedback for improvement?
Question: Which are the most popular Fiori applications and who are the most engaged users?
Translation: Which users have adopted the application and who can we approach for feedback?
Question: Which time of the day, week, month or year are users most active?
Translation: How can we identify the best way to balance our load and sizing?
Unless you are using Fiori Launchpad on SAP Cloud Platform (SCP), there is no readily available solution that helps clients answer these questions… until now, of course.
How You Can Get The Most Out of Your Applications
Based on SAP Fiori and UI5, we’ve built an analytics application that doesn’t rely on Google Analytics, APIs, or any third-party cloud storage – just the existing SAP system for data storage.
Below is a look at some of the ways you can visualize user engagement.
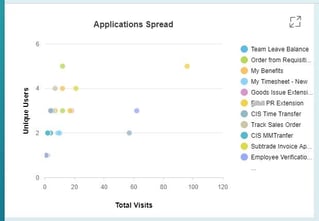
Applications Spread
Find an easy-to-digest breakdown of the number of users and their total visits, per application.
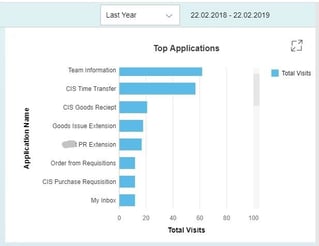
Top Applications
See which applications are getting the most engagement at your organization.
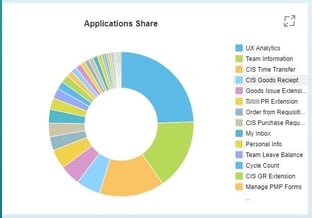
Applications Share
In this high-level view, adjust your preferences to monitor the applications you're most interested in.
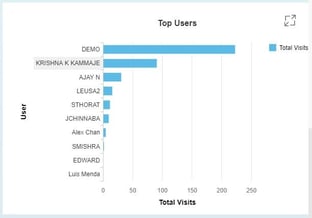
Top Users
Find out who your most active users are quickly and easily - they may be your best asset for feedback.
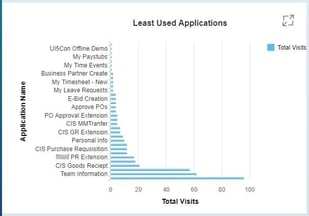
Least Used Applications
Take a look at possible improvement areas by finding out which applications are least used.
Here are a few more features of the application:
- In addition to UI5 application tiles, it can track WebGUI, WebDynpro and external link tiles.
- It can work completely on-premise.
- It can work on SCP even if you have your Fiori Launchpad on SCP.
- It does not require HANA. (But if you do have HANA, you’ll have even more features)
- The app uses SAP Fiori design principles, so it can be accessed on any device and as a tile on your Fiori Launchpad.
- Bonus: it can measure its own usage, too!
Putting the Fiori Analytics app to work for you
Modernizing your business should never feel like a risky venture. A lot of time and effort goes into an implementation, and the ability to identify how apps are being used (in a way that’s easy to understand) is critical to evaluating success.
Though a seamless execution with full adoption is always the goal, sometimes certain applications need a little more effort after go-live. Fiori Analytics can help you determine which areas could use more feedback and testing from your users, which fosters your users’ belief that you care about their experience.
So, the next time someone asks, “How are our users actually engaging with this interface?” you can say, “Let me show you!”